An analysis, written by this project
FY26, as the books stood in June
The school department’s FY26, read line by line from the town’s own ledger. What the $482,101 headline actually is, and three things it cannot explain.
lunenburgbudgetproject.org — written by the Lunenburg Budget Project, an independent tool for residents. Not affiliated with the Town of Lunenburg, the School Committee or the school district. The document this page renders: /docs/analyses/fy26-closeout.md
Working state:
notes/HANDOFF.mdcarries the current branch and what is established versus assumed.CLAUDE.mdcarries the rules.
Analysis, 2 September 2026. Every figure recomputed by scripts/verify_fy26_closeout.py from sources/data/lunenburg.db.
Each section is written twice: In plain terms for anyone, and The evidence for anyone who wants to check it. The plain version never states anything the evidence does not support.
What this rests on, and what it is not
On 2 September 2026 the Town Manager sent the FY26 year-to-date budget report in two forms, printed and as a spreadsheet. It is the first account-level general fund expenditure report this project has ever held. Every prior one was run as a department rollup, which renders the entire school district as a single row.
Here the school department is 258 accounts, each with an org code, an object code and a description.
Three limits travel with every figure below, and none of them is a technicality.
It is period 12, not period 13 — June, before purchase orders are cleared in the lapse period. The Town Manager put it exactly right in her covering note, and this document borrows her framing rather than inventing a more anxious one:
"This is the current FY26 report — figures likely to continue to adjust as we continue the year-end reconciliation process."
Current, not final. Both halves of that matter. An earlier draft of this document leaned on the second half and let it imply the first was in doubt, which is its own kind of error: a hedge stretched past what the evidence supports reads as "this might be nothing", and it is not.
What can change is bounded. The only money in play is the $236,783.89 still encumbered: at the close each purchase order is either paid, which leaves the unspent figure where it is, or released, which raises it. The department's final figure lands between $482,101 and $718,885, and only late invoices posted against period 13 could push it lower. In FY25 the same step moved the school figure up, from $582,115.44 to $603,885.97 — 3.7%, which here would be about $18,000.
So nothing here is a surplus, and nothing here is provisional in the sense of being doubtful. It is a position, it is a large one, and the close settles the last few percent.
Zero-balance accounts are suppressed. The report was run with Suppress zero bal accts: Y. An account absent from it is not necessarily absent from the ledger, and nothing below reasons from what is missing.
It is expenditures only, Fund 0100. No grants, no revolving funds, no school choice. The district's budget is net — a line is what the town must raise after other money has paid for part of the thing — so none of this says what anything costs.
In one page
The district spent 97.3% of its budget. That is the sentence to carry away, and it is the one most likely to be lost. FY26 finished with $482,101 unspent of $26.3 million — 1.8%, and not a pot of money sitting in a drawer.
Is this FY25 happening again? No, and the difference is checkable. The Town's explanation for the FY25 surplus was unfilled posts in the facilities department. In FY26 Facilities & Grounds spent its salary budget to the dollar — three accounts, three exact matches, nothing left on any of them. Whatever produced this year's underspend, it is not last year's mechanism. §7.
And there are three things this report cannot explain. They are here, at the top, rather than at the bottom:
- Kindergarten paraprofessionals. The FY26 approved budget cut the line and published it as a −100% cut, in those words. $99,064 was spent on them anyway, with no appropriation and no transfer, while six other zero-budget accounts did get transfers. Three readings fit and nothing here chooses between them. §3.
- $85,090 of budget moved into the department across 82 accounts, and no document in this archive connects any of it to a decision. §5.
- One of the district's four school psychologist accounts paid nobody all year, while the other three were paid in full or slightly over. §4.
Nothing here is an accusation and none of it is hidden. The district published the kindergarten cut itself, at −100%, on page 7 of its own approved budget. The town produced the ledger on request within a day. Where the budget worked, this report says so.
Where the underspend actually comes from — grouped by what the money buys, there are two different stories and only one is about anybody's decisions.
| what the money buys | budget | left | % of its own budget |
|---|---|---|---|
| People — salaries, subs, stipends | $17,111,089 | +$192,211 | 1.1% |
| Insurance and unemployment | $3,752,758 | +$104,527 | 2.8% |
| Supplies, materials, equipment | $584,728 | +$88,883 | 15.2% |
| Tuition, transport, contracted services | $3,915,262 | +$78,556 | 2.0% |
| Utilities and communications | $958,493 | +$17,924 | 1.9% |
Every large category landed within three percent of budget. People, insurance, tuition, utilities — $25.7 million between them, all of it close. That is a budget set about right, and it is four fifths of the underspend. The dollars are big because the bases are big, not because anything went wrong.
But the people line is not quiet underneath. Its 1.1% is two role groups pulling hard in opposite directions: paraprofessionals $210,082 over, with every one of seven accounts over, and psychologists and social workers $194,718 under — though that side is three accounts rather than a pattern, one of which paid nobody all year. They land $15,363 apart. Teachers — $12.3 million, the largest and least discretionary payroll in the town — came in at 1.3%.
That pair is the most striking thing in the year and the document does not read it as one substituting for the other. Two lines moving opposite ways by similar amounts is the exact inference this project has got wrong before.
One small category missed by 15%, and it is the discretionary one. Supplies, materials, maintenance and equipment: 67 of its 78 accounts came in under. The median salary account spent 100% of its budget; the median supply account spent 88%. A salary is paid or it is not; a supply order is placed or it is not.
So the cause is not one thing that went wrong. It is a large budget landing 1.8% off, plus about $89,000 of things somebody chose not to buy. Even if every discretionary line had been spent in full, the department would still have finished around $393,000 under.
What moved most is not what was left. Out-of-district special education tuition swung hardest in both directions — private placements $522,629 under, collaborative placements $434,108 over — and netted to $88,522.
Three things this year cannot explain, and each names the document that would.
- Kindergarten paraprofessionals were cut to zero in the FY26 approved budget — published openly, at −100% — and $99,064 was spent on them anyway, with no appropriation and no transfer. Three readings fit and nothing here chooses between them.
- $85,090 of budget moved into the department across 82 accounts, and no document in the archive connects any of it to a decision.
- One of the district's four school psychologist accounts spent nothing all year, while the other three spent theirs in full.
And $1,736,376 was spent on the schools from funds the budget document cannot see — grants, revolving funds, fees. Not one dollar of it can be attached to a line. Every figure in this document is the town's share, not the cost.
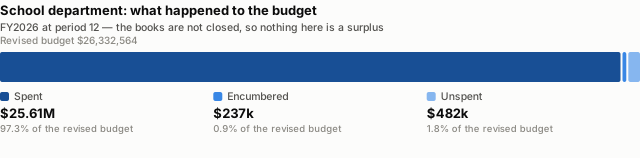
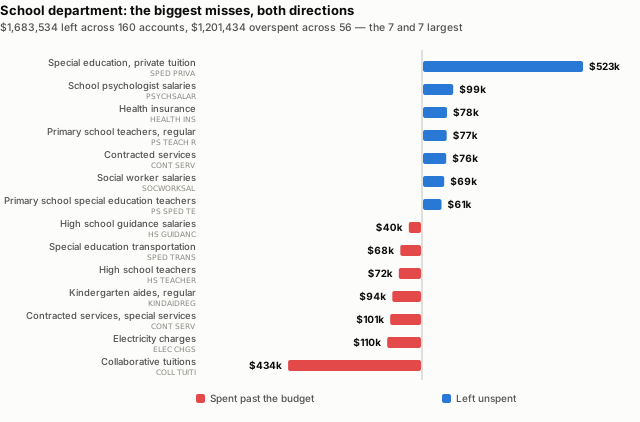
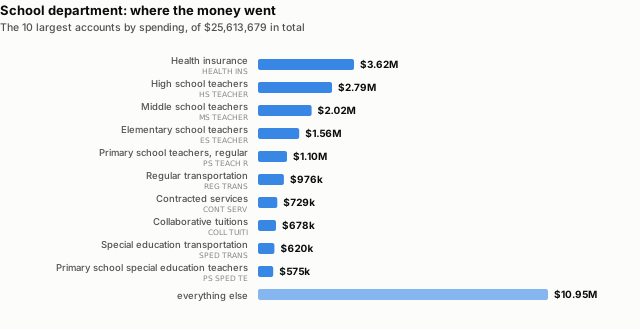
These three pictures are the whole document in outline. The first shows that almost all of the budget was spent. The second shows that the small leftover is the residue of large movements in both directions. The third shows what the money bought. Everything below is those three facts, itemised and sourced.
1. The headline number is a residual, not a result
In plain terms
The school department was $482,101 under budget in June. That single number is the small remainder of two much larger flows running in opposite directions: about $1.68 million unspent across 160 accounts, and about $1.20 million overspent across 56.
Reading $482,101 as "the schools underspent by half a million" describes the arithmetic correctly and the year not at all.
The evidence
| Original appropriation | $26,247,474.00 |
| Transfers and adjustments | $85,090.24 |
| Revised budget | $26,332,564.24 |
| Expended | $25,613,679.23 |
| Encumbered | $236,783.89 |
| Unspent | $482,101.12 |
| accounts | amount | |
|---|---|---|
| Under their revised budget | 160 | $1,683,534.14 |
| Over their revised budget | 56 | $1,201,433.65 |
| Net | 258 | $482,101.12 |
Town-wide at the same period: $51,189,965.10 appropriated, $2,826,046.42 transferred, $52,163,984.85 spent, $529,325.69 encumbered, $1,322,700.98 unspent.
The Town's own release of 1 September 2026 put the school figure at "approximately $470,000 to $600,000" and the town-wide figure at "roughly $1.63 million". The school figure here sits inside that range near the bottom. The town-wide figures differ and are not reconciled here — the release is preliminary, this is one report at one period, and nothing published says how the release's figure was struck.
What this does not show
Whether any of it survives the close. Encumbrances of $236,783.89 are still open, and clearing purchase orders releases some of that back and commits the rest.
1a. Where the $482,101 actually comes from
In plain terms
"Some things overspent, some things underspent" is true and useless. Grouped by what the money buys, the year has two different stories in it, and only one of them is about anybody's decisions.
Story one: the big categories all landed within 1–3% of budget. People, insurance, tuition and transport, utilities — between them $25.7 million, every one of them within three percent. That is a budget set about right. The dollars are large only because the bases are large. Four fifths of the underspend is this.
Story two: the small discretionary category missed by 15%. Supplies, instructional materials, building maintenance and equipment — $584,728 budgeted, $88,883 unspent, and 67 of its 78 accounts came in under. That is not a forecasting error. It is what happens when people are told to be careful about what they buy.
The evidence
| what the money buys | accounts | budget | left | % of its own budget | share of the $482,101 |
|---|---|---|---|---|---|
| People — salaries, subs, stipends | 112 | $17,111,089 | +$192,211 | 1.1% | 40% |
| Insurance and unemployment | 3 | $3,752,758 | +$104,527 | 2.8% | 22% |
| Supplies, materials, equipment | 81 | $584,728 | +$88,883 | 15.2% | 18% |
| Tuition, transport, contracted services | 42 | $3,915,262 | +$78,556 | 2.0% | 16% |
| Utilities and communications | 18 | $958,493 | +$17,924 | 1.9% | 4% |
| 258 | $26,332,564 | +$482,101 | 1.8% |
Inside the people line, one layer down
$192,211 on a $17.1 million payroll is 1.1%, which is the kind of number that looks like rounding. It is not. It is two role groups moving hard in opposite directions, and the small net is what is left when they nearly cancel.
| role group | accounts | budget | left | % of its own budget |
|---|---|---|---|---|
| Paraprofessionals | 7 | $1,415,449 | −$210,082 | −14.8% |
| Teachers and professional salaries | 29 | $12,347,689 | +$157,791 | 1.3% |
| Social workers | 4 | $369,029 | +$99,060 | 26.8% |
| School psychologists | 4 | $287,780 | +$95,658 | 33.2% |
| Everything else in the people line | 10 | $324,622 | +$29,244 | 9.0% |
| Stipends and coaching | 8 | $208,525 | +$16,433 | 7.9% |
| Overtime | 10 | $43,073 | +$14,626 | 34.0% |
| Substitutes, long-term and daily | 29 | $1,467,971 | −$8,011 | −0.5% |
| Secretarial and clerical | 11 | $646,951 | −$2,507 | −0.4% |
| the people line | 112 | $17,111,089 | +$192,211 | 1.1% |
Three things in that table are worth reading twice.
Teachers — the largest payroll in the town — landed at 1.3%. $12.3 million budgeted across 29 accounts, $157,791 left. On the biggest and least discretionary thing the district buys, the budget was set almost exactly right.
Every paraprofessional line overspent, and none underspent. Seven accounts, $1.4 million budgeted, $210,082 over — including the $93,691 kindergarten line that had no budget at all (§3). This is the only role group in the district where not one account came in under.
The student support underspend is three accounts, not a pattern. Psychologists at 33.2% and social workers at 26.8% look like a group effect, and they are not. Of the eight accounts, five spent their budget or slightly over; the whole $194,718 is:
| account | budget | spent | left | |
|---|---|---|---|---|
S2072061 | PSYCHSALAR — spent nothing all year | $98,784 | $0 | +$98,784 |
S2066651 | SOCWORKSAL | $90,212 | $20,877 | +$69,335 |
S2055651 | SOCWORKSAL | $92,939 | $63,214 | +$29,725 |
The other five: two social worker lines spent exactly their budget to the dollar, and three psychologist lines went slightly over — by $200, $200 and $2,726. So this is not support staffing coming in light across the board. It is one post that paid nobody and two that paid somebody for part of a year.
The two that nearly cancel — and what that does not mean
| Student support staff — psychologists and social workers | +$194,718 |
| Paraprofessionals, including kindergarten | −$210,082 |
| together | −$15,363 |
Two role groups, moving in opposite directions, within $15,363 of each other on a combined budget of $2.07 million.
It is very tempting to read that as one thing substituting for another — support posts unfilled while paraprofessional hours grew to cover the same children. Nothing here establishes that, and this is the third time in this document the same trap has appeared: two lines moving in opposite directions by similar amounts is precisely the inference CLAUDE.md records as having shipped from this project before and been wrong.
What is established is four numbers, and the shapes underneath them are not even symmetrical: the paraprofessional overrun is every account in the group, while the support underspend is three accounts out of eight with the other five at or slightly over budget. A group-wide movement and three individual lines are not the same kind of thing, and reading them as two halves of one trade requires ignoring that.
Other readings fit equally well — the support posts may have been budgeted for a full year and filled late, the paraprofessional overrun may be contractual step increases or hours, and the two may have nothing to do with each other. Dollars are not people, and no headcount is published.
The number that separates the two stories
Across accounts with a budget over $200:
| accounts | median share of budget spent | |
|---|---|---|
| Salary accounts | 74 | 100% |
| Supply, material and equipment accounts | 72 | 88% |
A salary is paid or it is not. A supply order is placed or it is not. The median salary account spent its entire budget; the median supply account spent 88% of it, 14 of them spent under half, and 5 spent nothing at all.
The largest examples are ordinary and recognisable:
| account | budget | spent | ||
|---|---|---|---|---|
545004 | EMERG EXP — emergency expenses | $30,000 | $9,000 | 30% |
541002 | BLDG MTC — building maintenance | $80,229 | $51,534 | 64% |
541001 | CUST SUPPL — custodial supplies | $75,000 | $58,406 | 78% |
545003 | GRNDS SUPP — grounds supplies | $49,937 | $38,555 | 77% |
545001 | ACESUPPLIE — ACE supplies | $12,000 | $3,333 | 28% |
An emergency line spending 30% of its budget is a contingency that was not needed, which is the same shape as the Reserve Fund on the town side. The rest are things somebody chose not to order.
One thing somebody asked for, in the same year
A category underspending by 15% is an abstraction until it sits next to something concrete. On 24 June 2026 the president of the football boosters told the School Committee:
"Casey, the head coach put in a request to the athletic department to purchase five new helmets earlier this spring, we currently have more heads than we have helmets."
In the same fiscal year, the athletics equipment and uniform lines stood at:
| account | budget | spent | left | ||
|---|---|---|---|---|---|
555048 | EQUIP RECO — equipment reconditioning | $8,292 | $3,649 | 44% | +$4,643 |
519104 | UNIFSPORTS — sports uniforms | $3,812 | $1,103 | 29% | +$2,709 |
555050 | NEW EQUIP — new equipment | $7,708 | $6,391 | 83% | +$1,317 |
| the three together | $19,812 | $11,143 | 56% | +$8,669 |
Athletics as a whole — 14 accounts — finished $51,905 under, including $20,407 for an athletics secretary post that paid nobody.
This is adjacency, and it is not an allegation. Reconditioning a helmet is not buying one; the request was made "earlier this spring" and nothing here dates the decision on it; a line can be committed without being spent; and one person's account of one request is not a record of what the athletic department decided or why. The report does not say the money was there and was refused.
What it does say is that a resident asking why five helmets could not be bought will find these numbers, and a report describing a 15% underspend in this category owes them the sight of it rather than making them look.
So what caused the underspend?
Nothing dramatic, and that is the finding. Roughly:
- $192,211 is the residue of a $17.1 million payroll landing 1.1% off — which given 38 accounts over and 42 under is a payroll budgeted close to right and then reconciled line by line during the year.
- $104,527 is health insurance and unemployment coming in 2.8% under a $3.75 million forecast, with nothing over. A rate-times-headcount estimate that landed slightly high.
- $88,883 is discretionary purchasing, and it is the one component that reflects choices rather than forecasts.
- $78,556 is the residue of $1.34 million of movement in tuition and transport that very nearly cancelled itself out.
What this does not show
That the district held back on purpose. A 15% underspend on supplies is consistent with deliberate restraint after a hard budget year, with orders that slipped past 30 June, with prices coming in lower, and with lines that were over-budgeted to begin with. The ledger shows the pattern. It does not show the reason, and one year cannot separate those four.
And it is not where the money is. Even if every discretionary line had been spent in full, the department would still have finished about $393,000 under. The large categories are where the dollars are, and they are the ones that behaved.
A second pair, on the purchased side
The staffing pair above is not the only one. Two placement lines move against each other by a similar amount, and they are a different kind of thing: not posts filled or unfilled, but services bought from outside providers.
| budgeted | spent | ||
|---|---|---|---|
Private placements — SPED PRIVA | 988,630 | 466,001 | +$522,629 |
Collaborative tuition — COLL TUITI | 302,663 | 678,062 | −$434,108 |
| together | +$88,522 |
Private placement spent 47% of its budget. Collaborative tuition spent 224% of its. Across all twenty-three special education lines: $5,150,013 budgeted against $5,091,367 spent, so the group as a whole is within $58,646 of budget. The total barely moves while the composition moves by roughly half a million.
This is the fourth time this trap appears in this document, and the answer is the same. Two lines moving in opposite directions by similar amounts does not establish that anything moved between them. A placement reclassified between provider types, a collaborative rate change mid-year, one line habitually over-budgeted and the other under, a coding change, or genuinely fewer private placements and more collaborative ones all produce these four numbers.
But this pair can be narrowed further than the staffing one, and without any student data. These are invoices from institutional providers, and an expenditure report at transaction level would separate readings that the annual totals cannot:
| what the invoices would show | what it distinguishes |
|---|---|
| the same providers, larger amounts | a rate change |
| the same amounts, more invoices | a volume change |
| a provider appearing part-way through the year | a new placement or a new provider |
| a single amount near the year end | a true-up, not in-year growth |
That is a price-and-volume split, and it needs only the amount, the date and the provider — all institutions, none of them a person. It would not say how many children are placed where. It would say whether this line grew because the price rose or because more was bought, which is the question a budget actually turns on.
What would settle the rest. Placement counts by setting and year, which nobody publishes, and which is already on this project’s standing list. Between the invoice detail and the counts, the invoice detail is both obtainable and sufficient for the budget question; the counts answer a different question about children, and should not be treated as the only route to this one.
2. The biggest movers
In plain terms
Two out-of-district special education lines account for most of the movement in both directions, and they move opposite ways. Beneath them sit one of the district's four psychologist accounts that spent nothing all year, a utility overrun, and paraprofessional lines that all ran over.
The evidence
| account | revised | spent | encumbered | left | |
|---|---|---|---|---|---|
S0511062 | SPED PRIVA — out-of-district, private | $988,630 | $466,001 | $0 | +$522,629 |
S5511062 | COLL TUITI — out-of-district, collaborative | $302,663 | $678,062 | $58,708 | −$434,108 |
S3991742 | ELEC CHGS — electricity | $271,132 | $319,109 | $62,362 | −$110,338 |
S1511062 | CONT SERV — special services contracted | $105,500 | $204,758 | $1,262 | −$100,520 |
S2072061 | PSYCHSALAR — one of four psychologist accounts, §4 | $98,784 | $0 | $0 | +$98,784 |
S2032121 | KINDAIDREG — kindergarten paras | $0 | $93,691 | $0 | −$93,691 |
S3991692 | SPED TRANS — special ed transport | $565,735 | $620,025 | $13,265 | −$67,555 |
| 4 accounts | special education paraprofessionals | $1,352,508 | $1,458,152 | $0 | −$105,644 |
The last column is revised − spent − encumbered, not revised − spent, and the encumbrance column is printed because without it the arithmetic does not appear to work. COLL TUITI is the clearest case: $302,663 − $678,062 is $375,399, and the figure is $434,108, because $58,708 is committed under purchase orders that have not yet been paid. An earlier version of this table showed the variance and omitted the encumbrance it was computed from.
An encumbrance is money promised under a signed contract and not yet paid out. At the year-end close some of it is paid and the rest is released back, which is exactly the step this report predates.
The two out-of-district lines together: $1,291,293 budgeted, $1,144,063 spent, a net of +$88,522.
What this does not show
Why the two out-of-district lines moved in opposite directions. It is tempting to read a shift from private placements toward collaboratives. That precise inference — two budget lines moving in opposite directions by similar amounts — is one of the three errors CLAUDE.md records as having shipped here before being caught. What is established is the two numbers. Placement counts by year are not published, so dollars cannot distinguish fewer children from a different mix from a differently struck budget.
Whether the special education paraprofessional overruns mean more staff. They are dollars. A budget line is not a filled position.
3. Kindergarten paraprofessionals — an open question
In plain terms
The FY26 approved budget cut the kindergarten paraprofessional line to zero and published it as a −100% cut. During FY26, $99,064 was spent on kindergarten paraprofessionals anyway, against an appropriation of nothing and with no transfer covering it. In February 2026, while that spending was happening, the district asked for a kindergarten paraprofessional back as a new staffing request for FY27, at $22,205. It did not make the FY27 proposed budget.
No meeting document connects either the cut or the spending to a decision. Kindergarten paraprofessionals do appear in the minutes — twice — and both times as an FY27 staffing request, never in relation to FY26. The distinction matters and an earlier draft of this section did not make it.
This is not presented as an impropriety. Money is routinely spent and reconciled later through a year-end transfer, and the FY26 transfer schedule is exactly what we do not have.
The evidence
The cut, published. FY26 School Committee approved budget, 12 March 2025, page 7, under 2330 - Paraprofessionals General Education:
Kindergarten Paraprofessionals 77,699.88$ 73,273.00$ (73,273.00)$ -100.00% (73,273.00)$ -100.00% H.S. Paraprofessionals /Regular 18,435.23$ 47,960.00$ (47,960.00)$ -100.00% (47,960.00)$ -100.00%
The history, from the FY27 workbook (fy27-proposals.xlsx, sheet FY27 Budget Projection, and identical in its traceable twin):
| cell | value | |
|---|---|---|
C332 | FY23 actual | $75,501.66 |
D332 | FY24 actual | $77,699.88 |
E332 | FY25 actual | $83,765.97 |
F332 | FY25 budget | $73,273.00 |
G332 | FY26 final budget | - |
J332–M332 | every FY27 proposal | - |
Row 333, Kindergarten Aides/Regular, exists only from FY26: G333 = 0, H333 = 59,709.10 of actuals to date. That row is the ledger account surfacing in the workbook, not a renamed budget line — it does not appear in the FY26 approved budget at all.
The spending, from the ledger at period 12:
| account | object | original | transfers | revised | spent |
|---|---|---|---|---|---|
S2032121 KINDAIDREG | 511103 | $0 | $0 | $0 | $93,691.03 |
S2032131 KINDPARREG | 511203 | $0 | $0 | $0 | $5,373.12 |
$99,064.15 against an appropriation of $0.
The mechanism exists and was used elsewhere. Nine school accounts spent with no original appropriation. Six received a transfer to cover it — HS GUID SE $42,967, DUES/FEES $29,965, PHYS ED SU $550 among them. These two received nothing.
The request, in the minutes. Finance Committee, 26 February 2026, under Staffing Increase Requests — Primary School:
1 Interventionist to address the early literacy and math gaps: $72,441 1 Kindergarten Paraprofessional: $22,205
and, in the same list, "The above listed position costs do not include insurance costs." A resident named the same request in public comment to the School Committee on 10 March 2026.
Both mentions are FY27 requests. Neither refers to the FY26 cut or to the FY26 spending. That is the whole of what the minutes say.
A partial conclusion, offered as one
The service continued. Kindergarten paraprofessionals were paid throughout FY26 at a level comparable to prior years — $99,064 against actuals of $75,502, $77,700 and $83,766 in the three years before — while the line carrying them was budgeted at zero.
What this does not show, and three readings that fit equally well
- A recoding. The appropriation landed under a different line and the spending did not follow it.
H.S. Paraprofessionals /Regularwas cut the same way and shows no FY26 spending, so the cut was real somewhere; it is not established that it was real here. - A grant expected to cover it. The Town has stated that about $287,000 of out-of-district tuition was charged to the FY26 IDEA grant rather than the operating budget, so grant-shifting demonstrably happened in FY26. Nothing links it to this line.
- An unreconciled overrun awaiting the year-end transfer that has not yet been voted.
Do not treat the $22,205 request as the cost of the FY26 spending. It is one position, excluding insurance, in a different fiscal year. $99,064 ÷ $22,205 is arithmetic, not a headcount.
What would settle it
The FY26 year-end transfer schedule, by department and account, with the authority for each. And Finance Committee minutes from 14 July 2026 onward.
4. Four psychologist lines, and one of them spent nothing
In plain terms
The district carries four school psychologist accounts and four social worker accounts, one per building. Three of the four psychologist lines spent their budget in full or a little over. The fourth spent nothing at all, all year — $98,784 budgeted, $0 out.
The social worker lines are less stark but point the same way: two spent in full, one spent 68%, one spent 23%.
Between them the eight accounts left $194,718 unspent, which is about 40% of the department's entire net underspend.
The evidence
| account | budgeted | spent | ||
|---|---|---|---|---|
S2044061 | PSYCHSALAR | $98,784 | $101,510 | 103% |
S2055061 | PSYCHSALAR | $45,106 | $45,306 | 100% |
S2066061 | PSYCHSALAR | $45,106 | $45,306 | 100% |
S2072061 | PSYCHSALAR | $98,784 | $0 | 0% |
| four psychologist accounts | $287,780 | $192,122 | ||
S2044651 | SOCWORKSAL | $92,939 | $92,939 | 100% |
S2055651 | SOCWORKSAL | $92,939 | $63,214 | 68% |
S2066651 | SOCWORKSAL | $90,212 | $20,877 | 23% |
S2072651 | SOCWORKSAL | $92,939 | $92,939 | 100% |
| four social worker accounts | $369,029 | $269,969 |
All eight carry object code 511023 or 511024, and none received a transfer.
Why it matters beyond the money
CLAUDE.md lists as a standing question: "Whether budgeted positions were filled. A budget line is an intention." For these eight lines, in this one year, the ledger comes closer to answering it than anything this project has held before — three lines paid in full look like filled posts, and one paid nothing does not.
What this does not show
That a post was vacant. A line spending nothing is consistent with a vacancy, with a person paid from a different account, with a grant-funded position, or with a coding change. Rule 7: the measurement is the dollars.
And it is deliberately not stated as "a school psychologist was cut". An earlier draft of this section quoted the zero line alone and described it as a position budgeted and not spent, which read as a statement about the district's psychologists in general. It is one of four. scripts/verify_fy26_closeout.py caught it because the figure it derived from the database did not match the figure in the prose.
5. $85,090 moved into the schools — what that actually looks like
In plain terms
"$85,090 of transfers" is not one movement. It is 82 separate account changes: 49 accounts had budget added, 33 had budget taken away, and the difference between those two piles is $85,090.
Most of it is the department moving its own money around during the year — an overrun here covered by an underspend there. The net is what came from outside the department.
And the ledger cannot tell you what any transfer was from. It records that an account's budget changed. It does not record the counterparty. That is in the transfer schedule, and the transfer schedule is what the Finance Committee twice did not have.
The evidence
| accounts | amount | |
|---|---|---|
| Budget added | 49 | $394,928.82 |
| Budget taken away | 33 | $309,838.58 |
| Net into the department | 82 | $85,090.24 |
The largest movements in each direction:
| account | change | original | |
|---|---|---|---|
S0990991 SCHSALRESE | school salary reserve | −$90,769.62 | $90,770 |
S2516061 HS SPED RE | H.S. special ed | −$81,075.96 | $449,087 |
S2066651 HS GUID SE | H.S. guidance | +$42,966.92 | $0 |
S2514131 ESSPEDPARA | E.S. special ed paras | +$33,623.36 | $225,152 |
S0011742 CONT SERV | contracted services | +$31,291.13 | $257,000 |
S3066672 DUES/FEES | athletics dues and fees | +$29,965.45 | $0 |
S2055711 MS REG SUB | M.S. substitutes | +$21,230.45 | $11,000 |
S3066672 ATH INS | athletics insurance | −$20,000.00 | $29,000 |
S2032711 KIND LONG | kindergarten long-term subs | −$15,000.00 | $15,000 |
What a transfer looks like, read off this table. S0990991 SCHSALRESE is a salary reserve — a contingency line budgeted at $90,770 and deliberately not attached to any job. Over the year it gave up every dollar, ending at zero. That is a reserve doing exactly what a reserve is for. S2032711 KIND LONG gave up its whole $15,000 the same way, and S2516061 gave up $81,076 of a $449,087 special education line.
On the other side, HS GUID SE and DUES/FEES both started at $0 and were given $42,967 and $29,965 — accounts that had no budget until money was moved into them. Which is precisely what did not happen for the kindergarten paraprofessional accounts in §3.
Where the net $85,090 came from
Not established. Town-wide, net transfers into the general fund at period 12 are $2,826,046.42 — so this is not a closed system in which one department's gain is another's loss. The town's SALARY RESERVE department gave up $128,953.67, and the capital projects and trust fund transfer accounts took in $1,240,820.32 and $795,437.00. Whether any of the school department's $85,090 came from the salary reserve, from a Town Meeting vote, or from somewhere else cannot be read off this report, because the report shows each account's net change and never its counterparty.
What this does not show
That no vote happened. Minutes may not be posted yet, and not every transfer requires a Finance Committee vote. What can be said is that no document in this archive connects any of these 82 movements to a decision.
Finance Committee, 11 June 2026:
"a. Year End Transfers — The documents needed on this topic were not provided but should be available for the next meeting."
It returned to the agenda for 14 July 2026. The archive holds Finance Committee agendas through 27 August 2026 and minutes only through 11 June 2026.
6. The money that never appears in the budget at all
In plain terms
Alongside the general fund, the schools ran 21 other funds that spent money in FY26 — grants, revolving funds fed by fees, and gifts. Together they spent $1,736,376, and not one dollar of it appears in the district's budget document.
The largest is school lunch, which is a self-contained operation. But the next several are not: $409,035 of IDEA special education grants, $233,350 of extended day, $100,467 of athletics, $95,196 of after-school.
The evidence
These figures are period 9 — through 31 March 2026 — not period 12. They come from a different report from everything above, and the two cannot be added into a single year-end total. Where §1 says "period 12", this section says "through March".
| fund | revenue in | spent | balance | |
|---|---|---|---|---|
2200 | School Lunch Revolving | $572,231 | $739,586 | $287,771 |
1312 | Extended Day Revolving | $192,943 | $233,350 | $54,161 |
2813 | FY25 IDEA #240 | $0 | $229,398 | −$88,503 |
2814 | FY26 IDEA #240 | $0 | $179,637 | −$179,637 |
1301 | Chapter 658 (athletics) | $160,164 | $100,467 | $169,945 |
1305 | After School Activities | $111,376 | $95,196 | $148,578 |
2778 | FY25 SOA Evidence-Based | $0 | $68,647 | −$91,220 |
1308 | School Choice Revolving | $83,116 | $30,558 | $299,461 |
2672 | FY26 Family & Community #237 | $48,558 | $13,372 | $35,186 |
1306 | School Facilities Use | $18,670 | $12,354 | $71,559 |
2640 | Special Ed Circuit Breaker | $325,970 | $4,005 | $615,301 |
1311 | School Gift Fund | $22,486 | $2,911 | $109,398 |
| ten smaller funds | $26,896 | |||
| total | $1,736,376 |
Two things in that table worth reading twice
The IDEA grants spent $409,035 between them and took in nothing, ending at −$88,503 and −$179,637. A negative balance here means spending has run ahead of the reimbursement drawn down; grants are typically claimed in arrears. It is not an overdraft.
Special education circuit breaker took in $325,970 and spent $4,005, holding $615,301. Circuit breaker is the state's reimbursement toward high-cost out-of-district placements — the same thing §2's two tuition lines pay for. That is a large balance sitting beside a general fund tuition line that underspent by $522,629.
Nothing here links them. No document maps a fund's spending onto a budget line, so it cannot be said that circuit breaker money did or did not pay for a placement the general fund budgeted. The two facts sit next to each other and that is all.
What this does not show — and it is the whole of §6
Where any of this money went. The fund tells you its purpose, not the line it paid. School lunch plainly buys food; the IDEA grants plainly buy special education; but which special education — which staff, which placement, which of the 258 accounts it would otherwise have shown up in — is not published anywhere.
So every figure in sections 1 to 5 is the town's share. A line that fell may mean less service, or may mean one of these funds paid for it. The expense side cannot tell them apart, and neither can this document.
7. Money not spent on people — the closest we can get
In plain terms
The Town's own explanation for the FY25 surplus was unfilled posts: "significant turnover and unfilled positions in the facilities department resulted in unspent salaries and stalled maintenance projects." So the obvious question for FY26 is how much of the underspend is salary money that was budgeted for someone and not paid to anyone.
The answer is a ceiling, not a measurement, and the two must not be confused.
Salary accounts that came in under budget hold $573,623 — that is the most that could possibly be unfilled-post savings. But salary accounts that went over hold $399,162, so the net left on personnel is $174,460, about 36% of the department's net underspend.
Only three salary accounts of any size spent nothing at all, and they hold $125,239 between them.
The evidence
| accounts | amount | |
|---|---|---|
| Salary accounts under budget | 42 | $573,623 |
| Salary accounts over budget | 38 | $399,162 |
| Net left on salaries | 80 | $174,460 |
Salary accounts that spent nothing all year, above $5,000:
| account | budget | spent | |
|---|---|---|---|
S2072061 | PSYCHSALAR — school psychologist salaries | $98,784 | $0 |
S3066671 | ATHSEC — athletics secretary | $20,407 | $0 |
S2996101 | CCLT/CCL | $6,048 | $0 |
Seven more spent nothing and hold $4,644 between them. Five of those seven are $800 secretarial overtime lines, where spending nothing means no overtime was worked — not a vacancy. That is why the count matters less than it looks.
Salary accounts that spent less than 85% of their budget:
| account | budget | spent | left | ||
|---|---|---|---|---|---|
S2066651 | SOCWORKSAL — social worker salaries | $90,212 | $20,877 | 23% | $69,335 |
S2055651 | MS GUIDANC — middle school guidance | $131,509 | $97,988 | 75% | $33,521 |
S2055651 | SOCWORKSAL — social worker salaries | $92,939 | $63,214 | 68% | $29,725 |
S2016081 | HS ADM SEC — high school admin secretary | $51,973 | $38,249 | 74% | $13,724 |
S2514711 | ES SPED SU — elementary special ed substitutes | $18,393 | $10,697 | 58% | $7,696 |
| six more under 85% | $15,220 |
The FY25 explanation does not repeat in FY26
The Town named the facilities department. Whichever facilities it meant, neither shows the pattern in FY26.
The town's Facilities & Grounds salary accounts spent 100% of budget, to the dollar: DIR FAC SA $68,966 of $68,966, SAL STAFF $46,772 of $46,772, SALFACDIRE $123,250 of $123,250, nothing left on any of them. The school's own custodial and maintenance salary lines are at or over budget — MTC SYSTEM spent $262,082 against $261,711, primary school custodians $102,733 against $99,711.
So the mechanism the Town identified for FY25 is not what happened in FY26. Something else produced this year's underspend.
What this does not show, and it is most of what a reader wants
That any post was vacant. A salary line spending nothing is consistent with a vacancy and equally consistent with: the person being paid from a different account, the post being grant-funded, the line being left in the budget after the post was eliminated, or a coding change. Section 4's four psychologist accounts are the clearest case — three paid in full and one paid nothing — and even there the ledger says dollars, not people.
And a partial spend is weaker evidence still. 75% of a salary is equally consistent with a post filled in October, a resignation in April, a part-time appointment, or a person appointed at a lower step. Nothing here separates them.
A budget line is not a position. That is rule 7 and it applies with full force here: the quantity nobody publishes is a headcount, and the quantity we have is dollars.
What would settle it
A list of budgeted positions with their fill dates — the standing question notes/DATA-WANTED.md calls unanswerable. Failing that, the payroll register by account, which would show whether a line paid a person for part of the year or nobody at all. Neither is a report the town publishes.
8. Which lines give their money away
In plain terms
A line that is budgeted high and then hands its money to something else is doing the job of a contingency without being called one. Whether that is happening here is a fair question, and this is the year it first became askable — but one year cannot answer it.
In FY26, 33 school accounts gave up $309,839 of budget. Nearly a third of that is one account doing exactly what it exists to do.
The evidence
The accounts that gave away the largest share of what they started with:
| account | started with | gave up | left | spent | ||
|---|---|---|---|---|---|---|
S0990991 | SCHSALRESE — school salary reserve | $90,770 | −$90,770 | 100% | $0 | $0 |
S2032711 | KIND LONG — kindergarten long-term subs | $15,000 | −$15,000 | 100% | $0 | $0 |
S2066711 | HS LONG TE — high school long-term subs | $3,000 | −$2,956 | 99% | $44 | $0 |
S3066672 | ATH INS — athletics insurance | $29,000 | −$20,000 | 69% | $9,000 | $8,980 |
S2022711 | PS LONG SU — primary long-term subs | $15,000 | −$7,075 | 47% | $7,925 | $10,265 |
S1011022 | DUES/MTGS — dues and meetings | $8,000 | −$3,585 | 45% | $4,415 | $3,521 |
S2032711 | KIND SUBS — kindergarten substitutes | $4,000 | −$1,601 | 40% | $2,399 | $2,399 |
Reading it
The largest is a declared contingency and should not be counted as padding. SCHSALRESE is a salary reserve — budgeted at $90,770, attached to no post, and voted on that basis. Giving away every dollar is the whole point of it. It is 29% of everything the department gave up.
Three of the top five are substitute-teacher lines. KIND LONG, HS LONG TE and PS LONG SU are long-term substitute budgets that gave up 100%, 99% and 47%. A substitute line is a genuine forecast — you budget for absences you cannot predict — so it is the kind of line most likely to be set high and released. It is also the kind of line where "set high" and "set honestly" look identical from outside.
And ATH INS gave up $20,000 of a $29,000 insurance budget and then spent $8,980 of the $9,000 left. That is a line that turned out to need a third of what it was given.
What this does NOT show, and it is the whole limitation
That any of this is consistent. Establishing that a line is habitually over-budgeted takes several years of the same account. This project holds exactly one year at account level — FY26 at period 12 — so every figure above is a single observation. A line that gave away 100% once may do it every year or may have done it once.
CLAUDE.md rule 6 exists for this: a rate off one or two points is not a trend. One point is not even a rate.
And a 100% give-up is often a recoding rather than a release. The town side has the clearest example: SAL ELECTE gave up 97% of $80,629 while TN CLK SAL in a different department received $80,629 and spent $78,466. The Town Clerk's salary moved between lines. Nothing was over-budgeted; something was renamed.
What would settle it
The FY24 and FY25 reports at the same grain. Three years of the same accounts would turn every row above from an observation into a pattern or a one-off, and it is the same request already outstanding for other reasons. This is the strongest argument yet for asking for the back years rather than only the current one.
What this means
For a resident
Do not read the headline as slack. "The schools came in $482,101 under" is arithmetically true and tells you almost nothing. The department spent 97.3% of its budget; the leftover is a residue of much larger movements in both directions, and roughly a third of it is salary money on posts that were not filled for all of the year.
Wait for the close before treating any of it as money. These figures are from June with the books open. The FY25 figure moved twice, publicly, a fortnight apart.
The budget you vote on is not what the schools cost. It is the town's share. Another $1,736,376 came from grants, fees and revolving funds in the same year, and no published document says which lines it paid for. When somebody quotes a budget line as the cost of something, that is the gap they are standing in.
Where there is a real open question, it is a small number and a specific one. The kindergarten paraprofessional case is $99,064 against a line the district itself published as cut. It deserves an answer; it is not evidence of anything larger, and nothing in this document says it is.
A note for anyone comparing the two sides. The companion analysis, analyses/fy26-closeout-town.md, reads the same ledger for the other 67 departments. The town overspent on 18 of 376 accounts against the school department's 57 of 259. That difference is real and has at least four explanations, and neither document picks one. It is not a scoreboard.
For the School Committee and the Finance Committee
The control question, answered directly: what would you have had to see, and when?
- By December (period 6), the two out-of-district tuition lines would already have been visibly diverging. They finished $522,629 under and $434,108 over. Nothing about that shape appears in a total.
- By March (period 9), the kindergarten paraprofessional accounts had already spent roughly $59,709 against a zero budget — that figure is in the district's own March workbook. It was visible six months before anybody asked about it.
- The transfer schedule, at the time transfers were made rather than at year end, would have shown the $85,090 while it could still be questioned.
None of those requires a new report. They are the same glytdbud run at periods 6 and 9, and a schedule the Finance Committee already asks for.
The total is a poor control instrument. A department can land within 2% of budget while individual lines miss by hundreds of percent, and this one did. That is not a criticism of the budget; it is a statement about what a single number can tell you.
Two lines carry most of the volatility and both are special education placements. Private and collaborative tuition moved $956,737 between them in opposite directions on a combined budget of $1,291,293. That is the line to watch, and it is the line nobody controls — which is a reason to forecast it better, not a reason to skip it.
The year-end transfer schedule should be a routine published document. Eighty-two school accounts changed budget in FY26 and the ledger never records a counterparty. That is not a criticism of anyone's bookkeeping; it is a gap between what the system records and what a public body needs in order to approve it.
Where the budget did its job, it shows. The salary reserve was budgeted at $90,770, attached to no post, and distributed in full — a declared contingency working exactly as intended. Facilities spent its salary budget to the dollar. The district's own budget document published the kindergarten cut at −100% rather than burying it.
For whoever runs a department
A zero-budget line that spends without a transfer will look unexplained from outside, however ordinary it was. Six school accounts in FY26 spent against no appropriation and were covered by a transfer; two were not, and those two are the only ones anybody has questions about. The difference is a paperwork step, not a spending decision.
Substitute and reserve lines are read differently from everything else, and should be. A long-term substitute budget releasing most of its money is a forecast that came in low, not padding. This document says so explicitly, because the raw ranking would suggest otherwise.
One year cannot show a pattern, in either direction. Nothing here establishes that any line is habitually over- or under-budgeted, and any claim that it does is wrong. Three years at this grain would settle it, and the request is already outstanding.
What would change these findings
In order of how much each would settle:
- The FY26 period 13 report. Turns every figure here from a position into a result.
- The year-end transfer schedule, by account, with authority. Settles §3 and §5.
- The same report for funds other than 0100. Turns the net budget into a gross one.
- Finance Committee minutes from 14 July 2026.
- Out-of-district placement counts by year. The only thing that would let §2's two tuition lines be read as anything other than two numbers.
- Budgeted positions with their fill dates, or the payroll register by account. Turns §7's ceiling into a measurement.
- FY24 and FY25 at account level. §8 can show which lines gave money away once; only three years can show which do it habitually.
How to reproduce
python3 scripts/builddb.py python3 scripts/verifyfy26_closeout.py
Where this came from
Nothing on this page is an official document. It was written here, from documents the town and district published and from records obtained by request, and it has not been reviewed or endorsed by the Town of Lunenburg, the School Committee, the Finance Committee or Lunenburg Public Schools. The report index says the same thing at more length, and lists every analysis alongside the data underneath it.
This page renders the document itself, which is the source of truth: there is one copy of every sentence and every figure here, not a transcription of one. Every figure in it is recomputed from the underlying data by python3 scripts/verify_fy26_closeout.py, which fails rather than warns.
Every other report
Every analysis this project has written, in one index, is at reports.